
22 tools to compute DORA metrics
Have you already heard about the DORA metrics? Through 7 years of research, the DevOps Research and Assessment (DORA) team has identified four key metrics that indicate the performance of a software development team. Their definition comes from the DORA website:
Deployment Frequency—How often an organization successfully releases to production.
Lead Time for Changes—The amount of time it takes a commit to get into production.
Change Failure Rate—The percentage of deployments causing a failure in production
Time to Restore Service—How long it takes an organization to recover from a failure in production
How to compute the DORA metrics?
There’s already tons of Web content that gives more insights on the DORA metrics, and this post won’t have much more value in explaining those concepts again. One thing we often heard from customers was: “These metrics look great, but how do we compute them?”. Each organization might have its specificities, but if you’re looking for existing solutions that help compute these metrics, here is a list of 22 software platforms. We’re not going into details; consider this post as an entry point for your research.
As far as we know, all these tools follow a data aggregation model from your existing tools (CI/CD platforms, code repositories, issues tracking, …) and compute metrics from that.
At Promyze, we’re actively working on metrics that can address the learning & knowledge-sharing culture of engineering teams. That’s a capability found by DORA. We’ll talk about it in a later post 😉
#1 Oobeya
Website here.

#2 Swarmia
Website here.
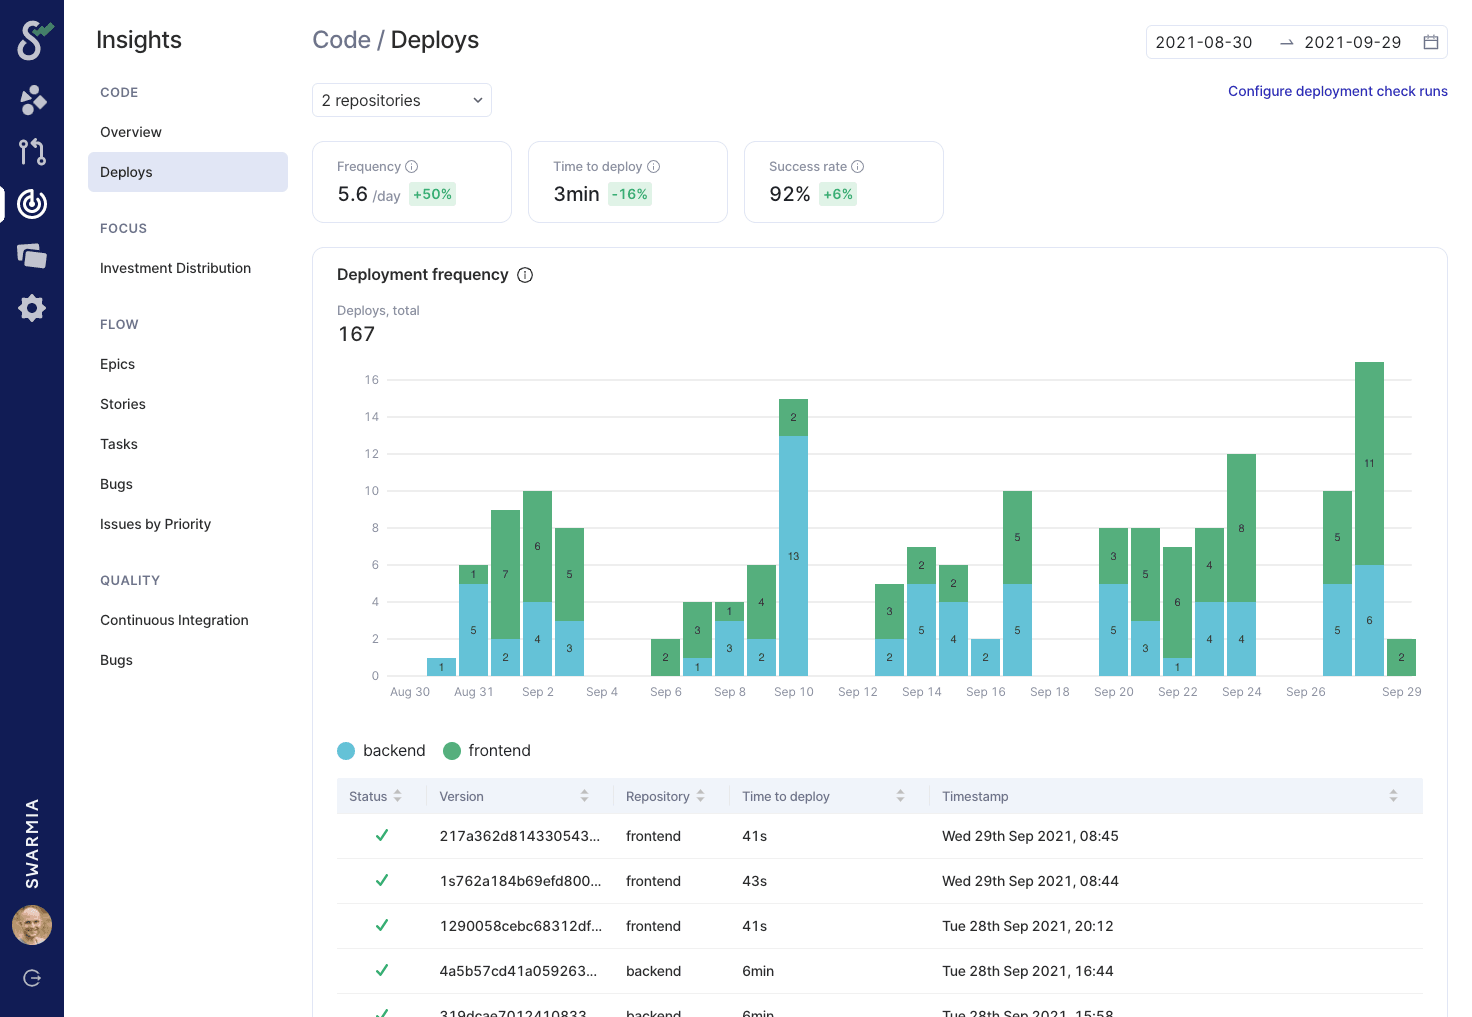
#3 Linearb
Website here.
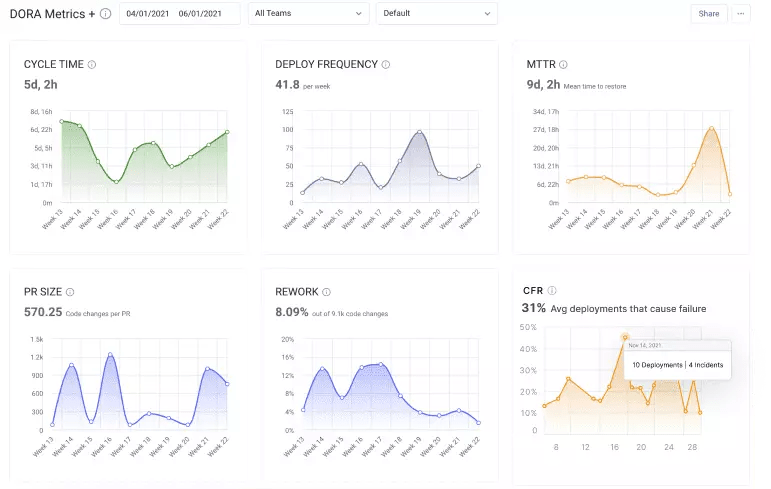
#4 Faros.ai
Website here.

#5 Plandek
Website here .
#6 Sleuth
Website here.
.svg)
#7 Insightly
Website here.

#8 Haystack
Website here.
.png)
#9 Pluralsight
Website here.

#10 Pulse
Website here.
#11 Propelo
Website here.
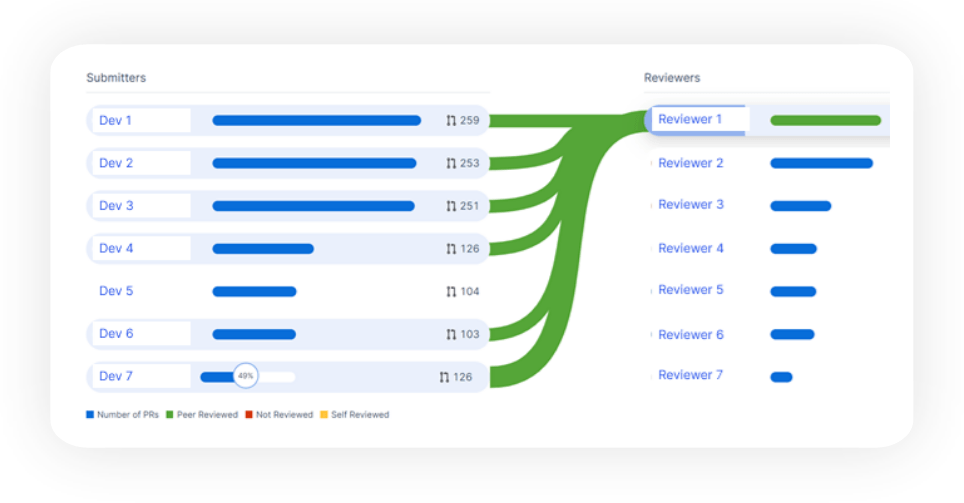
#12 CodeFresh
Website here.

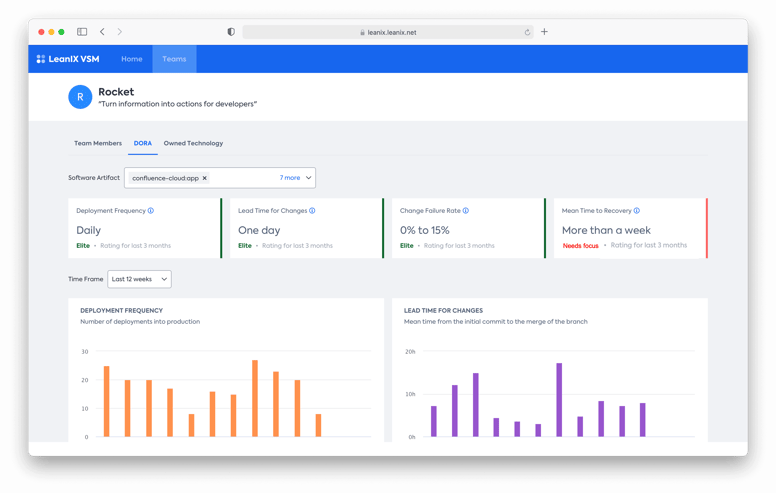
#13 LeanIX
Website here.
#14 Jellyfish
Website here.
#15 Keypup
Website here.

#16 Waydev
Website here.

#17 Hatica
Website here.

#18 Klera
Website here.

#19 Harness
Website here.

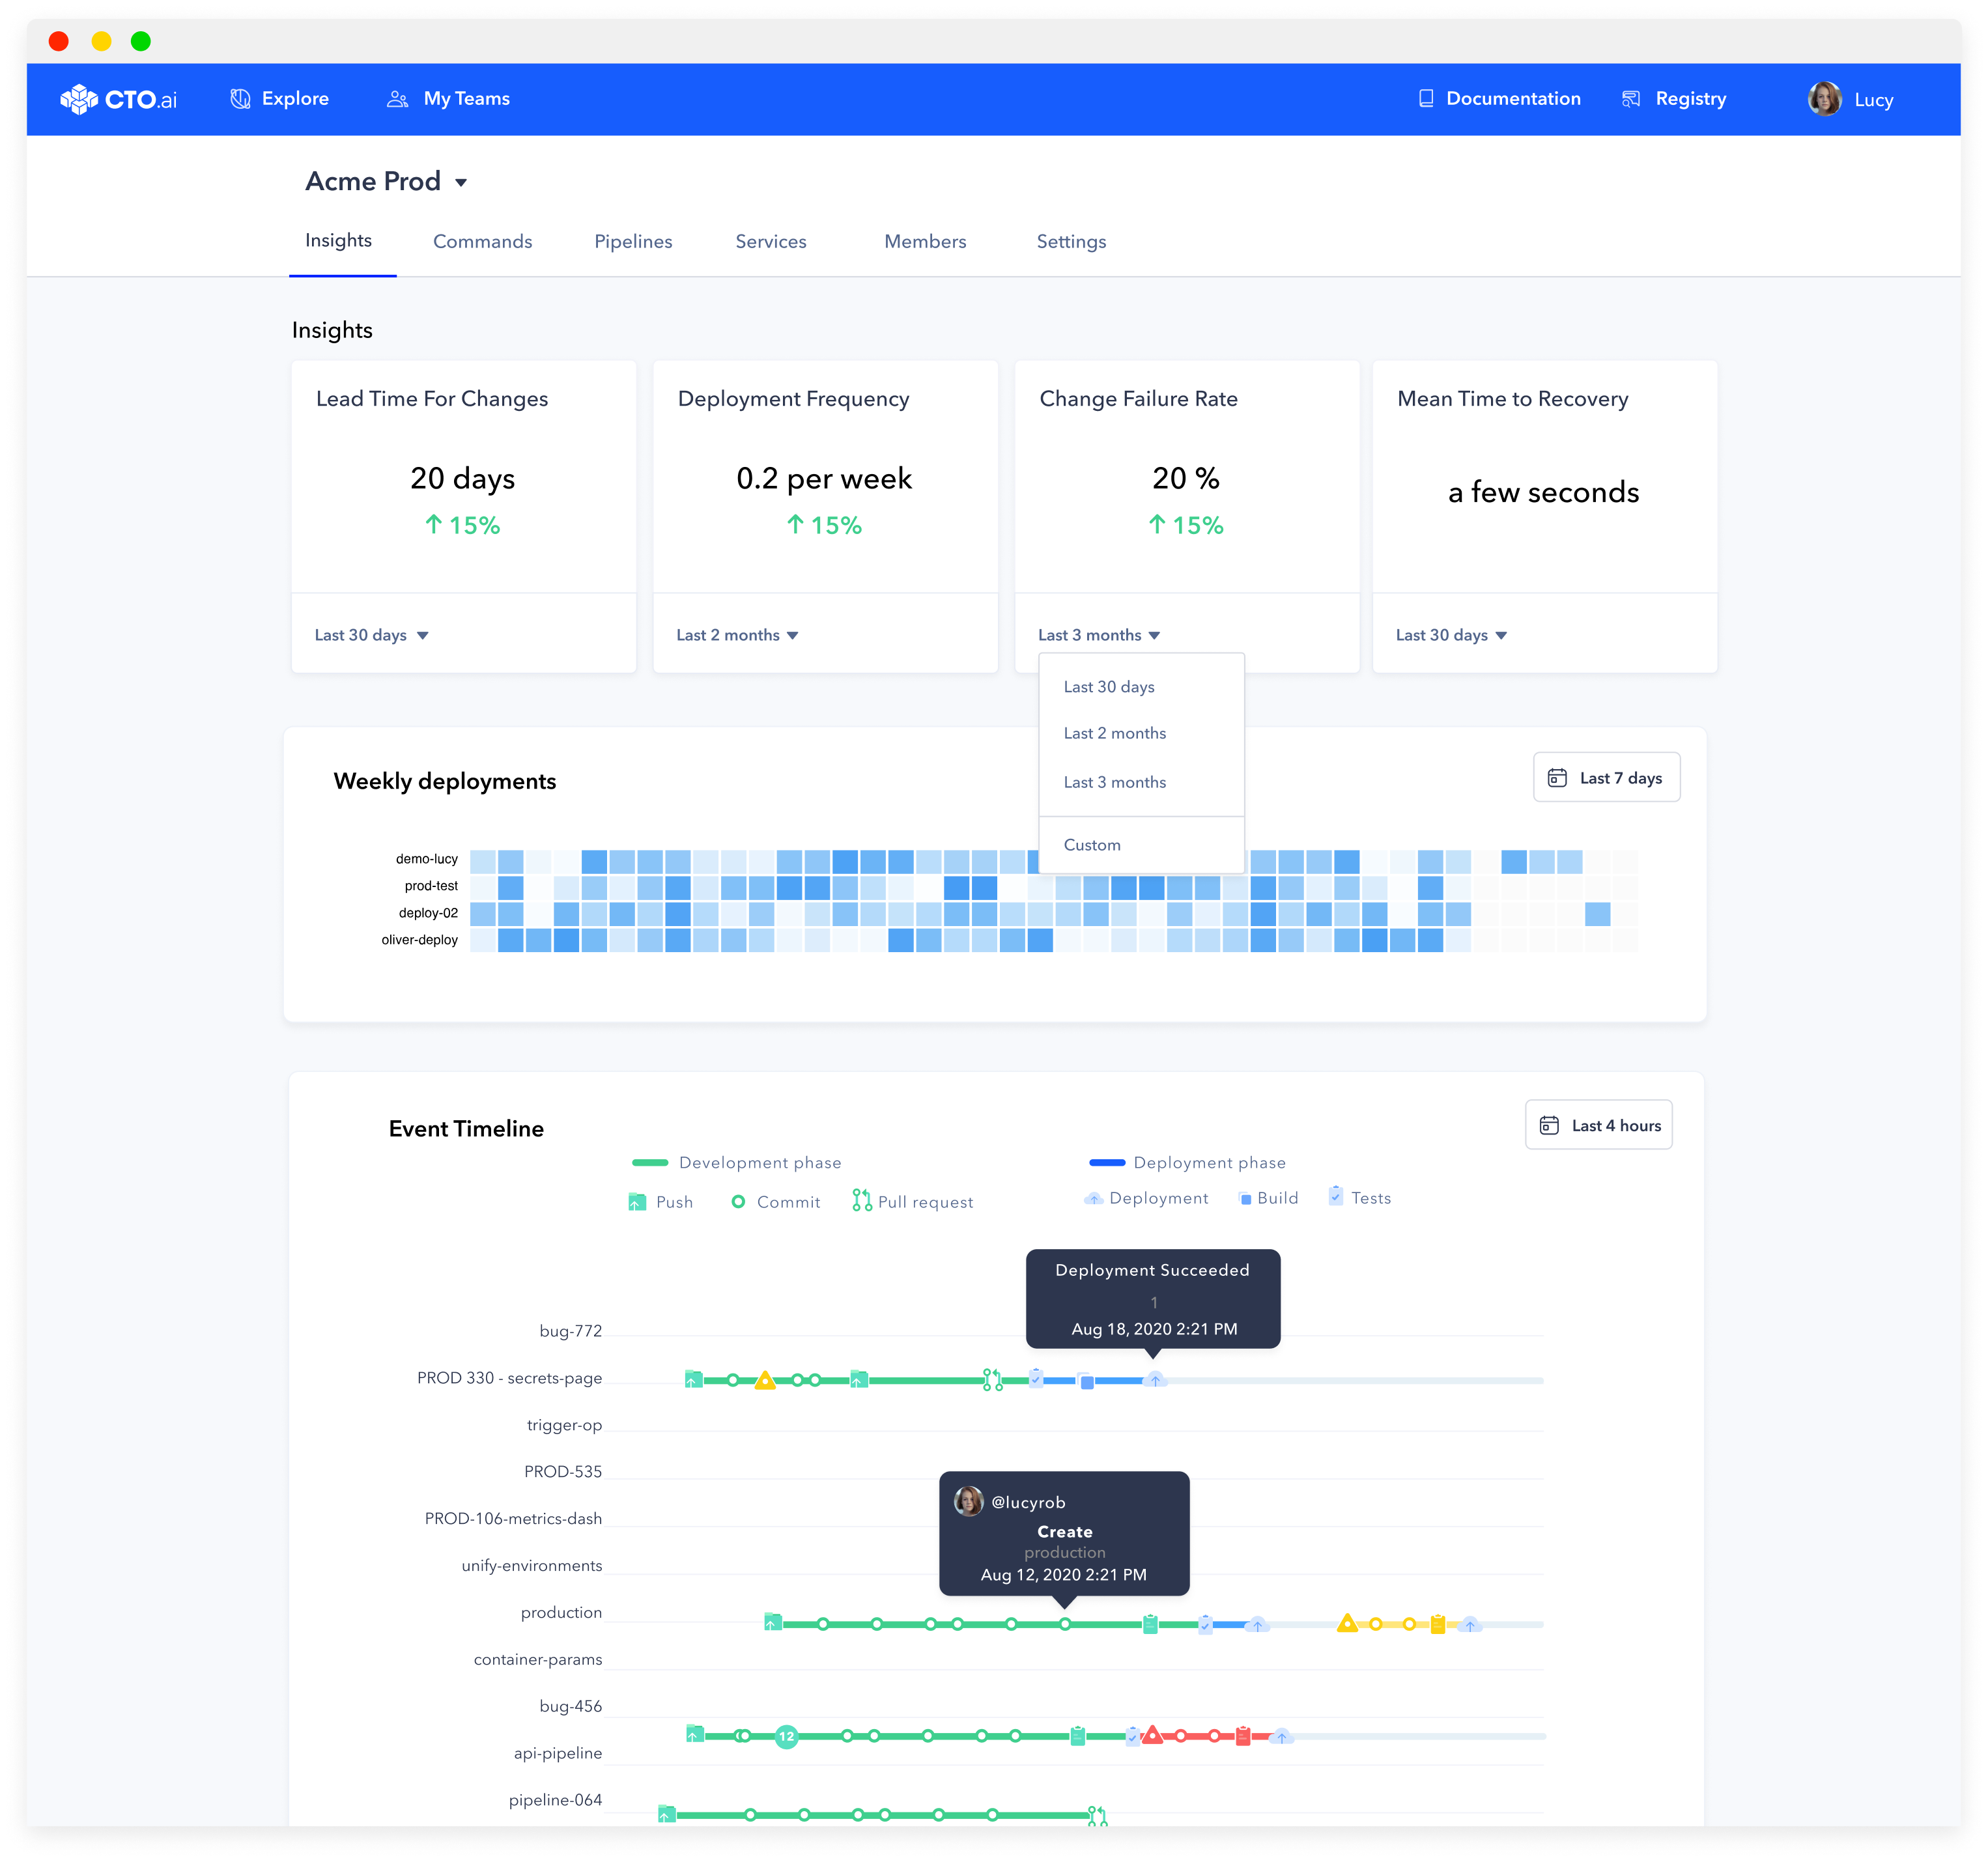
#20 CTO.AI
Website here.
#21 Opsera
Website here.

#22 Echoes HQ
Website here.
